
You spent weeks perfecting your homepage. The headline is clever, the photos are beautiful and the "Book Now" button is right there. Yet bookings are flat, and you have no idea why.
What if you could look over your visitors' shoulders and see exactly where they click, how far they scroll and where they give up?
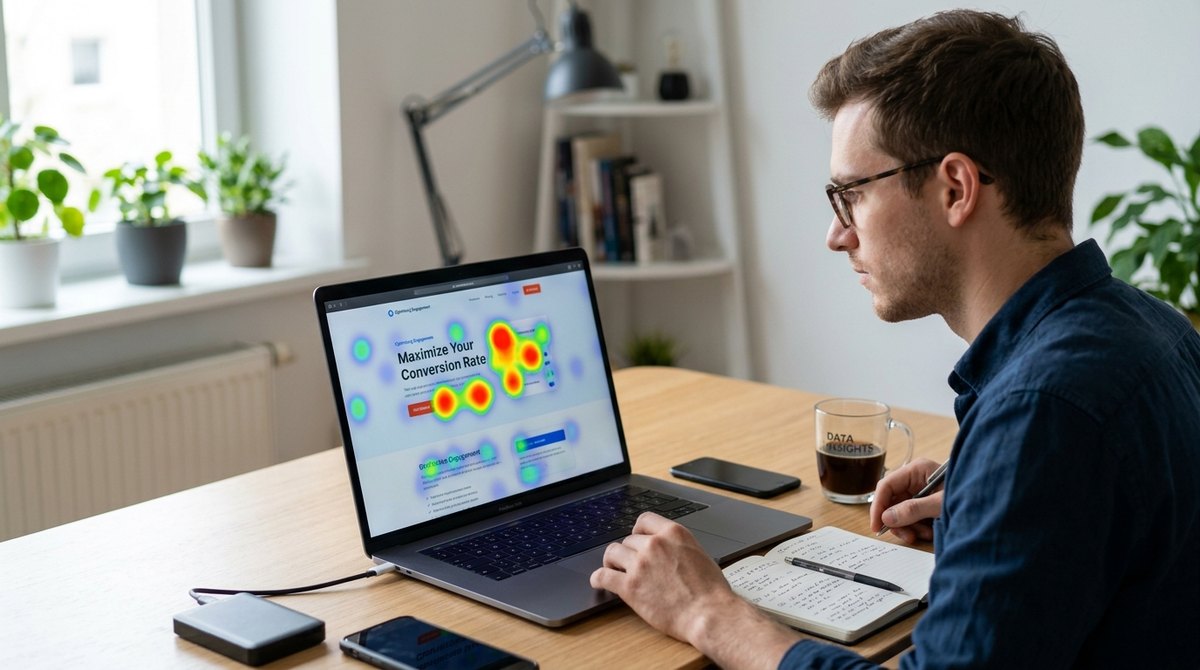
That's what a heatmap does. It turns invisible behavior into a simple, colorful picture, so you can stop guessing and start fixing what actually matters.
- Heatmaps show where visitors click, move and scroll, using warm colors for activity and cool colors for areas they ignore.
- Most attention stays near the top of a page, so your key message and button need to be high up.
- Free tools like Microsoft Clarity make heatmaps accessible to any small business.
- Look for rage clicks, dead clicks and drop-off points, then make one change at a time.
Stop Guessing How People Use Your Site
Analytics tools tell you how many people visited a page and how long they stayed. They rarely tell you what those people actually did. Did they see your offer? Did they try to click something that isn't a link? Did they leave halfway down?
Heatmaps fill that gap. They collect the behavior of many visitors and lay it over a picture of your page. Red and orange show hot spots with lots of activity. Blue and green show the cold areas people barely touch.
Your visitors are already telling you what's wrong. A heatmap lets you hear them.
The Three Heatmaps You Should Know
Click maps
Show where people click or tap. You'll quickly see which buttons work, which are ignored and what people click that isn't clickable at all.
Scroll maps
Show how far down the page visitors get. If most people stop before your offer, they never see it.
Move maps
Track mouse movement on desktop, which often roughly follows where people look and read.
Many tools also offer session recordings: anonymous replays of real visits. Watching a few is one of the fastest ways to spot confusion.
The Scroll Problem: Attention Stays at the Top
Research by the Nielsen Norman Group found that people spent about 57% of their page-viewing time on the first screenful, the area visible before scrolling, and about 74% within the first two screenfuls. People do scroll, but attention drops the further down they go.
A scroll map shows you exactly where that drop happens on your pages. If your "Book Now" button sits in a cold blue zone that only a small share of visitors reach, moving it higher can make a big difference.
Heatmap Tools to Get Started
- Microsoft Clarity: free, with click maps, scroll maps and session recordings. A great first choice for small businesses.
- Hotjar: popular and easy to use, with heatmaps, recordings and on-site surveys. It has a free plan with limits.
- Crazy Egg: one of the earliest heatmap tools, with A/B testing built in.
Setup usually takes minutes: create an account, copy a small tracking code and add it to your site. Most website builders and platforms have plugins or simple instructions. Then let it collect data for a week or two before drawing conclusions.
How to Read Your First Heatmap
1. Check your main button
Is your most important call to action a hot spot? If it's cold, it may be too low, too small or not clear enough.
2. Look for dead clicks
Hot spots on images, icons or text that aren't links mean people expect something to happen. Make those elements clickable, or change them so they don't look clickable.
3. Watch for rage clicks
Repeated fast clicks on the same spot usually signal frustration, such as a broken button or a slow page. Fix these first.
4. Find the drop-off line
On the scroll map, see where most people stop. Move key information and buttons above that line.
5. Compare mobile and desktop
Visitors behave very differently on phones. Always check both views separately.
Heatmaps work best alongside your regular analytics. Use analytics to find which pages matter most, such as pages with lots of visitors but few sales, then use heatmaps to see what's happening on those pages. Numbers tell you where the problem is. Heatmaps show you why.
Change one thing at a time, then compare the new heatmap with the old one. That way you know what actually made the difference.
Respect Your Visitors' Privacy
Heatmaps should study patterns, not spy on individuals. Choose tools that hide sensitive information like form fields and payment details, mention them in your privacy policy and, where the law requires it, such as in the EU and UK, ask for consent before tracking. Respecting privacy is part of earning trust.
Conclusion: Let Your Visitors Show You the Way
You don't have to guess why a page isn't working. Your visitors leave clues with every click and scroll.
Install a free heatmap tool this week, wait for a few hundred visits and study your most important page. Fix the one problem the heatmap shows most clearly, and you may be surprised how fast results improve.
Frequently Asked Questions
What is a website heatmap?
It's a visual overlay showing where visitors click, move and scroll on a page, with warm colors for high activity and cool colors for low activity.
Are there free heatmap tools?
Yes. Microsoft Clarity is free and includes click maps, scroll maps and session recordings. Hotjar also offers a limited free plan.
What are rage clicks?
Rage clicks are repeated rapid clicks on the same spot, usually a sign of frustration with something broken, slow or confusing.
How much traffic do I need for a heatmap?
A few hundred visits to a page usually gives a useful picture. Let the tool collect data for a week or two before deciding.
Are heatmaps legal under privacy laws?
They can be, if you use tools that hide sensitive data, mention tracking in your privacy policy and ask for consent where the law requires it.